Reading FITS Files
Contents
Reading FITS Files
from astropy.io import fits
import numpy as np
import matplotlib.pyplot as plt
import matplotlib as mpl
plt.rcParams['figure.dpi']=150
Reading a FITS File
file_name = 'd165_os_bs_ff_bp_crj.fits'

# Let's open the fits file and call it HDUL (Header Data Unit List, which is some historical name I guess)
hdul = fits.open(file_name)
# Sometimes there are multiple FITS files in a single FITS file.
# This one only has a single file, though, which appears to be a single image.
hdul.info()

# we can print the header
# it's better to use "display" which prints things nicely :)
header = hdul[0].header
Filename: d165_os_bs_ff_bp_crj.fits
No.    Name      Ver    Type      Cards   Dimensions   Format
  0  PRIMARY       1 PrimaryHDU     158   (1024, 1024)   float32
display(header)
SIMPLE  =                    T / conforms to FITS standard
BITPIX  =                  -32 / array data type
NAXIS   =                    2 / number of array dimensions
NAXIS1  =                 1024
NAXIS2  =                 1024
CRVAL1U =                 2048 / COLUMN ORIGIN
CRVAL2U =                 2048 / ROW ORIGIN
CDELT1U =                   -2 / COLUMN CHANGE PER PIXEL
CDELT2U =                   -2 / ROW CHANGE PER PIXEL
OBSNUM  =                  165 / OBSERVATION NUMBER
IDNUM   =                    1 / IMAGE ID
UGEOM   =                    0 / UCAM READOUT GEOMETRY
DGEOM   =                    0 / DESCRAMBLE GEOMETRY
AMPSROW =                    1 / AMPLIFIERS PER ROW
AMPSCOL =                    1 / AMPLIFIERS PER COLUMN
OBSTYPE = 'OBJECT'             / IMAGE TYPE
EXPTIME =                  180 / Exp time (not counting shutter error)
COMMENT    Real Value = FITS*BSCALE+BZERO
PROGRAM = 'NEWCAM'             / New Lick Camera
VERSION = 'nickel_direct'      / Data acquisition version
TSEC    =           1570855422 / CLOCK TICK - SECONDS
TUSEC   =               657384 / CLOCK TICK - MICROSECONDS
DATE    = '2019-10-12T04:43:42.65' / UT of CCD readout & descramble
DATASEC = '[1:1024,1:1024]'        / IRAF/NOAO-style data section
COMMENT End of cards hard-coded in fits_cards
COMMENT Begin of cards from other times
CSYER2  =     0.01666669920087 / systematic error along direction of WCS axis i
CSYER1  =     0.01666669920087 / systematic error along direction of WCS axis i
CRDER2  =   5.139999848325E-05 / random error along direction of WCS axis i
CRDER1  =   5.139999848325E-05 / random error along direction of WCS axis i
CD2_2   =  -0.0001027239995892 / CTM element i_j from FITS axis j to WCS axis i
CD2_1   =   3.946270226152E-06 / CTM element i_j from FITS axis j to WCS axis i
CD1_2   =  -3.946270226152E-06 / CTM element i_j from FITS axis j to WCS axis i
CD1_1   =  -0.0001027239995892 / CTM element i_j from FITS axis j to WCS axis i
CRVAL2  =       33.02922821045 / coord value of WCS axis i at ref pixel
CRVAL1  =       283.3957824707 / coord value of WCS axis i at ref pixel
CRPIX2  =                  512 / reference pixel along FITS axis j
CRPIX1  =                  512 / reference pixel along FITS axis j
CUNIT2  = 'deg               ' / unit of WCS axis i
CUNIT1  = 'deg               ' / unit of WCS axis i
EQUINOX =                 2000 / date of celestial reference frame
RADECSYS= 'FK5               ' / reference system for celestial coordinates
CNAME2  = 'Declination       ' / name of WCS axis i
CNAME1  = 'Right Ascension   ' / name of WCS axis i
CTYPE2  = 'DEC--TAN          ' / type of WCS axis i
CTYPE1  = 'RA---TAN          ' / type of WCS axis i
WCSNAME = 'Celestial coordinates' / name of WCS
CRVAL2C =                    0 / coord value of WCS axis i at ref pixel
CRVAL1C =                    0 / coord value of WCS axis i at ref pixel
CRVAL2S =       33.02922821045 / coord value of WCS axis i at ref pixel
CRVAL1S =       283.3957824707 / coord value of WCS axis i at ref pixel
CSYER2C =                    0 / systematic error along direction of WCS axis i
CSYER1C =                    0 / systematic error along direction of WCS axis i
CRDER2C =                    0 / random error along direction of WCS axis i
CRDER1C =                    0 / random error along direction of WCS axis i
CD2_2C  =                   -2 / CTM element i_j from FITS axis j to WCS axis i
CD2_1C  =                    0 / CTM element i_j from FITS axis j to WCS axis i
CD1_2C  =                    0 / CTM element i_j from FITS axis j to WCS axis i
CD1_1C  =                   -2 / CTM element i_j from FITS axis j to WCS axis i
CRPIX2C =                  0.5 / reference pixel along FITS axis j
CRPIX1C =                  0.5 / reference pixel along FITS axis j
CUNIT2C = 'CCDpix            ' / unit of WCS axis i
CUNIT1C = 'CCDpix            ' / unit of WCS axis i
CNAME2C = 'CCD Y pixel       ' / name of WCS axis i
CNAME1C = 'CCD X pixel       ' / name of WCS axis i
CTYPE2C = 'linear            ' / type of WCS axis i
CTYPE1C = 'linear            ' / type of WCS axis i
WCSNAMEC= 'CCD pixel coordinates' / name of WCS
CSYER2S =     0.01666669920087 / systematic error along direction of WCS axis i
CSYER1S =     0.01666669920087 / systematic error along direction of WCS axis i
CRDER2S =   5.139999848325E-05 / random error along direction of WCS axis i
CRDER1S =   5.139999848325E-05 / random error along direction of WCS axis i
CD2_2S  =  -0.0001027239995892 / CTM element i_j from FITS axis j to WCS axis i
CD2_1S  =   3.946270226152E-06 / CTM element i_j from FITS axis j to WCS axis i
CD1_2S  =  -3.946270226152E-06 / CTM element i_j from FITS axis j to WCS axis i
CD1_1S  =  -0.0001027239995892 / CTM element i_j from FITS axis j to WCS axis i
CRPIX2S =                  512 / reference pixel along FITS axis j
CRPIX1S =                  512 / reference pixel along FITS axis j
CUNIT2S = 'deg               ' / unit of WCS axis i
CUNIT1S = 'deg               ' / unit of WCS axis i
EQUINOXS=                 2000 / date of celestial reference frame
RADESYSS= 'FK5               ' / reference system for celestial coordinates
CNAME2S = 'Declination       ' / name of WCS axis i
CNAME1S = 'Right Ascension   ' / name of WCS axis i
CTYPE2S = 'DEC--TAN          ' / type of WCS axis i
CTYPE1S = 'RA---TAN          ' / type of WCS axis i
WCSNAMES= 'Celestial coordinates' / name of WCS
AIRMASS =       1.250841140747 / AIRMASS AT START OF OBSERVATION
OWNRNOTE= 'notyetset         ' / OWNRNOTE for archive data
OWNRHINT= 'notyetset         ' / OWNRHINT for archive data
HA      = '03:04:52.05       ' / HOUR ANGLE
DEC     = '33:01:45.1        ' / DECLINATION
RA      = '18:53:35.00       ' / RIGHT ASCENSION
DATE-BEG= '2019-10-12T04:40:42.04' / START OF OBSERVATION
EQUINOXU=       2019.780029297 / EPOCH FOR POCO POSITION IS CURRENT DATE
OBSERVER= 'Elinor Gates, 2019 Grad Workshop' / OBSERVER NAME
APERNAM = 'Open              ' / APERTURE POSITION NAME
INSTRUME= 'Nickel Direct Camera'
TUB     =                    0 / TELESCOPE TUB ROTATION
APERRAW =                 1250 / APERTURE RAW POSITION
FILTRAW =                 2853 / FILTER RAW POSITION
FILTORD =                    3 / FILTER ORDINAL POSITION
APERORD =                    0 / APERTURE ORDINAL POSITION
FILTNAM = 'R                 ' / FILTER POSITION NAME
DATE-END= '2019-10-12T04:43:42.04' / END OF OBSERVATION
GEOMCODE=                    0 / READOUT GEOMETRY
DSENSOR = 'Loral 2Kx2K       ' / SENSOR DESCRIPTION
DNAXIS2 =                 2048 / ROWS IN SENSOR
DNAXIS1 =                 2048 / COLUMNS IN SENSOR
UCAMADC = '4-amp QADC        ' / UCAM ADC BOARDS
UCAMCDB = 'New CDB           ' / UCAM CDB BOARDS
CAMERAID=                    2 / CAMERA ID NUMBER
UCAMSPB = '2 DSPB            ' / UCAM SPB BOARDS
UCAMSOFT= '4.08 052011       ' / UCAM SOFTWARE VERSION
UCAMTIM = 'New Timing        ' / UCAM TIMING BOARDS
GAIN    =                    1 / DCS GAIN INDEX
TEMPCON =                 12.5 / CONTROLLER TEMPERATURE
NCSHIFT =                    0 / NUMBER OF CHARGE SHUFFLES
RCSHIFT =                    0 / NUMBER OF ROWS IN EACH CHARGE SHUFFLE
ROVER   =                    0 / NUMBER OF OVERSCAN ROWS
COVER   =                   32 / NUMBER OF OVERSCAN COLUMNS
MPP     =                    1 / MPP STATE
TEMPDET =      -108.6999969482 / EXPOSURE START DETECTOR TEMPERATURE
TEMPDETE=                    0 / EXPOSURE END DETECTOR TEMPERATURE
READ-SPD=                   80 / DCS READ SPEED
ERPBIN  =                    5 / PARALLEL BINNING DURING ERASE
ERASE   =                    3 / NUMBER OF ERASES
PSKIP   =                    0 / CONTROLS POST-IMAGE SKIPPING
CSMP    =                    1 / DCS CAP SELECTION
CSELPRD =                    0 / PREREAD CLOCK SELECTION
SCLEAN  =                    0 / SERIAL CLEANING CLOCK SELECTION
BINPRD  =                    0 / PREREAD SERIAL BINNING
BINSCLN =                    0 / BINNING FOR SERIAL CLEAN
PPRERD  =                    4 / PRE-IMAGE ROWS
PFREQ   =                    1 / PARALLEL CLOCK PERIOD
PADDC   =                    0 / PARALLEL CLOCK CAPACITOR SELECTION
NSTIME  =                   32 / CONTROLS RISING TIME FOR SUBSTRATE
VSUBEX  =                    0 / SUBSTRATE VOLTAGE DURING EXPOSURE
VSUBER  =                    0 / SUBSTRATE VOLTAGE DURING ERASE
NHBESP  =                   32 / BINNING FOR SPECIAL ERASE
MERSP   =                    0 / CONTROLS SPECIAL ERASE MODE
TCPR1   =                    4 / PRE-IMAGE SERIAL PIXELS
TSPRD   =                   40 / SAMPLE TIME IN 0.1 MICROSECOND UNITS
TSCLEAN =                   40 / SERIAL CLEAN SAMPLE TIME
SFREQ   =                    2 / SERIAL CLOCK PERIOD
SADDC   =                    2 / SERIAL CLOCK CAP SELECTION
REVERASE=                    0 / NUMBER OF REVERSE ERASES
TCPR2   =                    4 / POST-IMAGE SERIAL PIXELS BEFORE OVERSCAN
OBJECT  = 'M57               '
CKSUMOK =                    T / cd: CHECKSUMS MATCH
CAMCKSUM=                 7254 / cd: CAMERA-COMPUTED CHECKSUM
SFTCKSUM=                 7254 / cd: SOFTWARE-COMPUTED CHECKSUM
COMMENT End of cards from other times
HISTORY Overscan subtracted
HISTORY Bias subtracted
HISTORY Flat Fielded
HISTORY Bad columns replaced
HISTORY CR and bad pixels fixed with astroscrappy
# we can treat the header as a labelled list, and get things from that list:
print(header['OBSNUM'])
165
# let's grab the image data since that's the only thing1
image = hdul[0].data
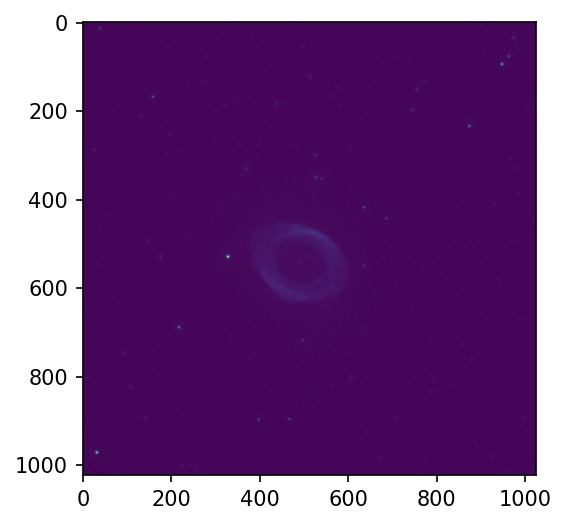
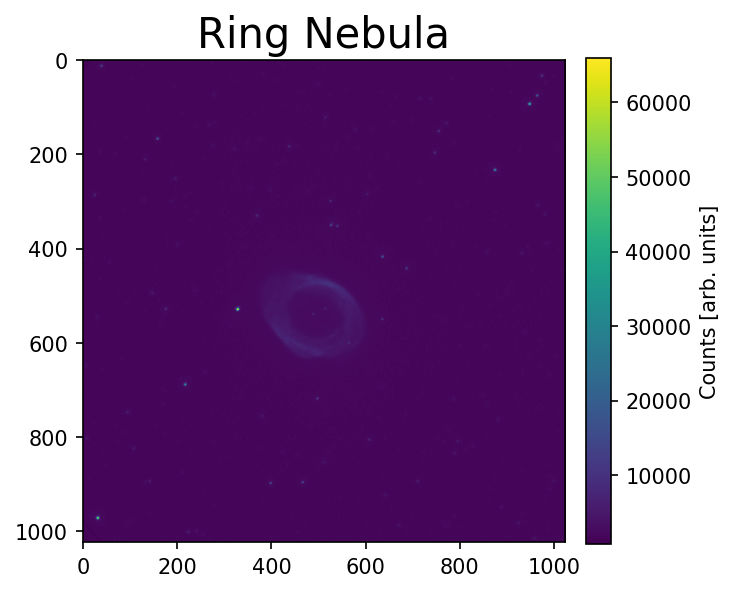
Raw Image Plot
# let's plot the image
plt.figure(figsize=[5,5])
im = plt.imshow(image)
plt.colorbar(im,fraction=0.046, pad=0.04,label='Counts [arb. units]')
plt.tight_layout()
plt.title('Ring Nebula',fontsize=20)
plt.show()
low  = np.percentile(image, 20)
high = np.percentile(image, 99.5)
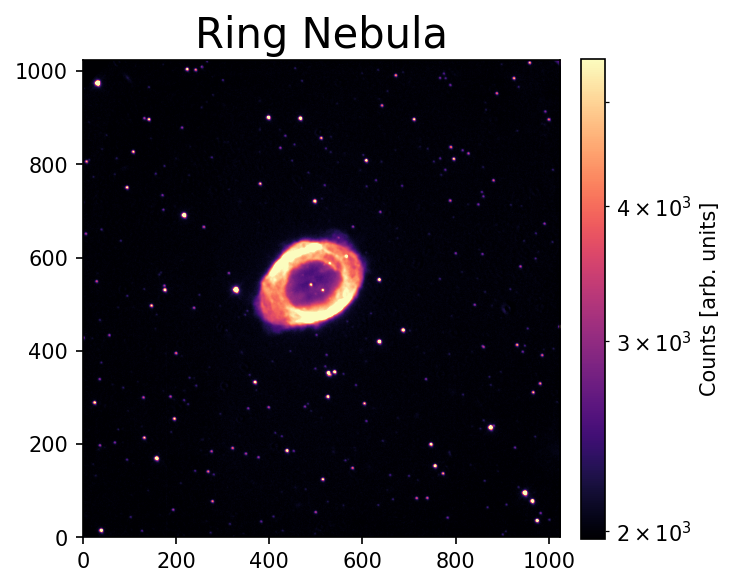
Adding Some Fancy Visuals :)
# let's plot the image
plt.figure(figsize=[5,5])
im = plt.imshow(image, vmin=low,vmax=high,norm=mpl.colors.LogNorm(),
          origin='lower',cmap='magma')
plt.colorbar(im,fraction=0.046, pad=0.04,label='Counts [arb. units]')
plt.tight_layout()
plt.title('Ring Nebula',fontsize=20)
plt.show()
/Users/jacobpilawa/anaconda3/lib/python3.7/site-packages/ipykernel_launcher.py:4: MatplotlibDeprecationWarning: Passing parameters norm and vmin/vmax simultaneously is deprecated since 3.3 and will become an error two minor releases later. Please pass vmin/vmax directly to the norm when creating it.
  after removing the cwd from sys.path.
# let's plot the image
plt.figure(figsize=[5,5])
im = plt.imshow(image, vmin=low,vmax=high,norm=mpl.colors.LogNorm(),
          origin='lower',cmap='magma')
plt.colorbar(im,fraction=0.046, pad=0.04,label='Counts [arb. units]')
plt.xlim(325,625)
plt.ylim(400,700)
plt.tight_layout()
plt.title('Ring Nebula',fontsize=20)
plt.show()
/Users/jacobpilawa/anaconda3/lib/python3.7/site-packages/ipykernel_launcher.py:4: MatplotlibDeprecationWarning: Passing parameters norm and vmin/vmax simultaneously is deprecated since 3.3 and will become an error two minor releases later. Please pass vmin/vmax directly to the norm when creating it.
  after removing the cwd from sys.path.
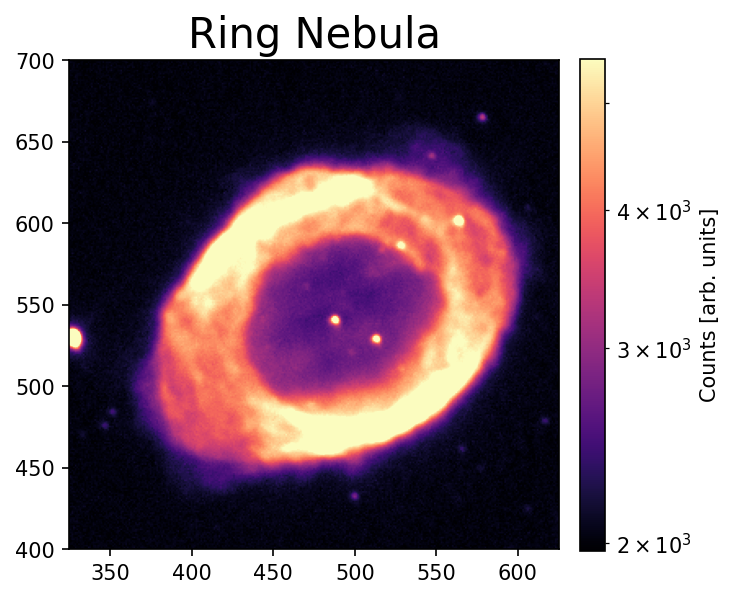
Image Stretching and Scaling
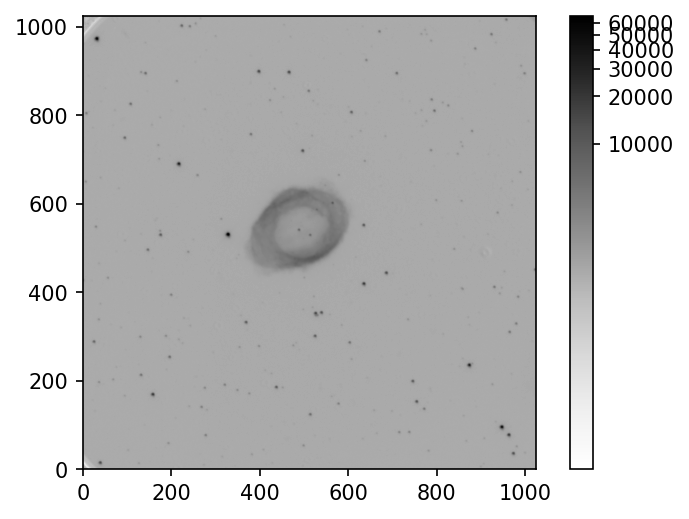
See: https://docs.astropy.org/en/stable/visualization/normalization.html
from astropy.visualization import (ZScaleInterval,MinMaxInterval, LogStretch, LinearStretch,
                                   ImageNormalize)
# Create an ImageNormalize object
norm = ImageNormalize(image, interval=MinMaxInterval(),
                      stretch=LogStretch())

# or equivalently using positional arguments
# norm = ImageNormalize(image, MinMaxInterval(), SqrtStretch())

# Display the image
fig = plt.figure()
ax = fig.add_subplot(1, 1, 1)
im = ax.imshow(image, origin='lower', norm=norm, cmap='Greys')
fig.colorbar(im)
<matplotlib.colorbar.Colorbar at 0x7fc5904c5050>
An alternate way to read files that I really like, and you might see:
with fits.open(file_name) as f:
    data = f[0].data
    f.close()
plt.imshow(data)
<matplotlib.image.AxesImage at 0x7fc58dd8dd90>
